
Mental Health, Therapy resources
Cbt Chart – Complete Guide

Jul
What a CBT Chart Actually Is
A CBT chart is a structured template that helps you map out the cognitive behavioral therapy process on paper. It’s basically a visual framework that shows the relationship between your thoughts, feelings, physical sensations, and behaviors in a specific situation. Most CBT charts follow some variation of a model that breaks down an experience into these components so you can see how they influence each other.
I remember in 2019 when I was working on a series about therapy worksheets and I kept seeing these charts labeled differently across different sites—thought records, CBT triangles, cognitive restructuring forms, hot cross bun diagrams. It drove me kinda crazy because they’re all essentially doing the same thing but packaged differently depending on which therapeutic tradition or textbook you’re pulling from.
The most common format you’ll see is either a five-column chart or a diagram with interconnected boxes. The five-column version typically includes: situation, automatic thoughts, emotions, physical sensations, and behaviors. Some versions add extra columns for evidence supporting or contradicting the thought, or alternative thoughts you could have instead.
The Core Components You’ll Find
Every CBT chart breaks down an experience into observable parts. The situation column is where you describe what actually happened—not your interpretation, just the facts. Like “my boss didn’t respond to my email for three days” rather than “my boss is ignoring me because she hates my work.”
The automatic thoughts section is where you write down the immediate thoughts that popped into your head during or right after the situation. These are usually fast, reflexive, and you might not even notice them happening in real time. They’re called automatic because they just show up without you deliberately thinking them through.
Emotions get their own column because feelings and thoughts aren’t the same thing, even though we mix them up constantly in everyday language. When someone says “I feel like nobody cares about me,” that’s actually a thought, not a feeling. The feeling might be lonely, sad, or rejected. You usually rate the intensity of each emotion on a scale from 0-100.
Physical sensations include things like tight chest, racing heart, tension in your shoulders, stomach churning, whatever your body does in response to the situation and the thoughts about it. This section often gets skipped or rushed through, which is annoying because the physical component is actually really important for understanding your full response pattern.
Behaviors are what you actually did in response to everything else. Did you avoid the person? Send a passive-aggressive text? Eat an entire sleeve of cookies? Went for a run? Called your friend? Whatever action you took goes here.
The Arrows and Connections
What makes a CBT chart useful isn’t just listing these components—it’s seeing how they connect. In diagram versions, you’ll see arrows showing that thoughts influence emotions, emotions influence physical sensations and behaviors, and behaviors can loop back to reinforce thoughts. It’s not linear. The whole point is that these elements create cycles that can keep you stuck or, if you intervene, can be changed.
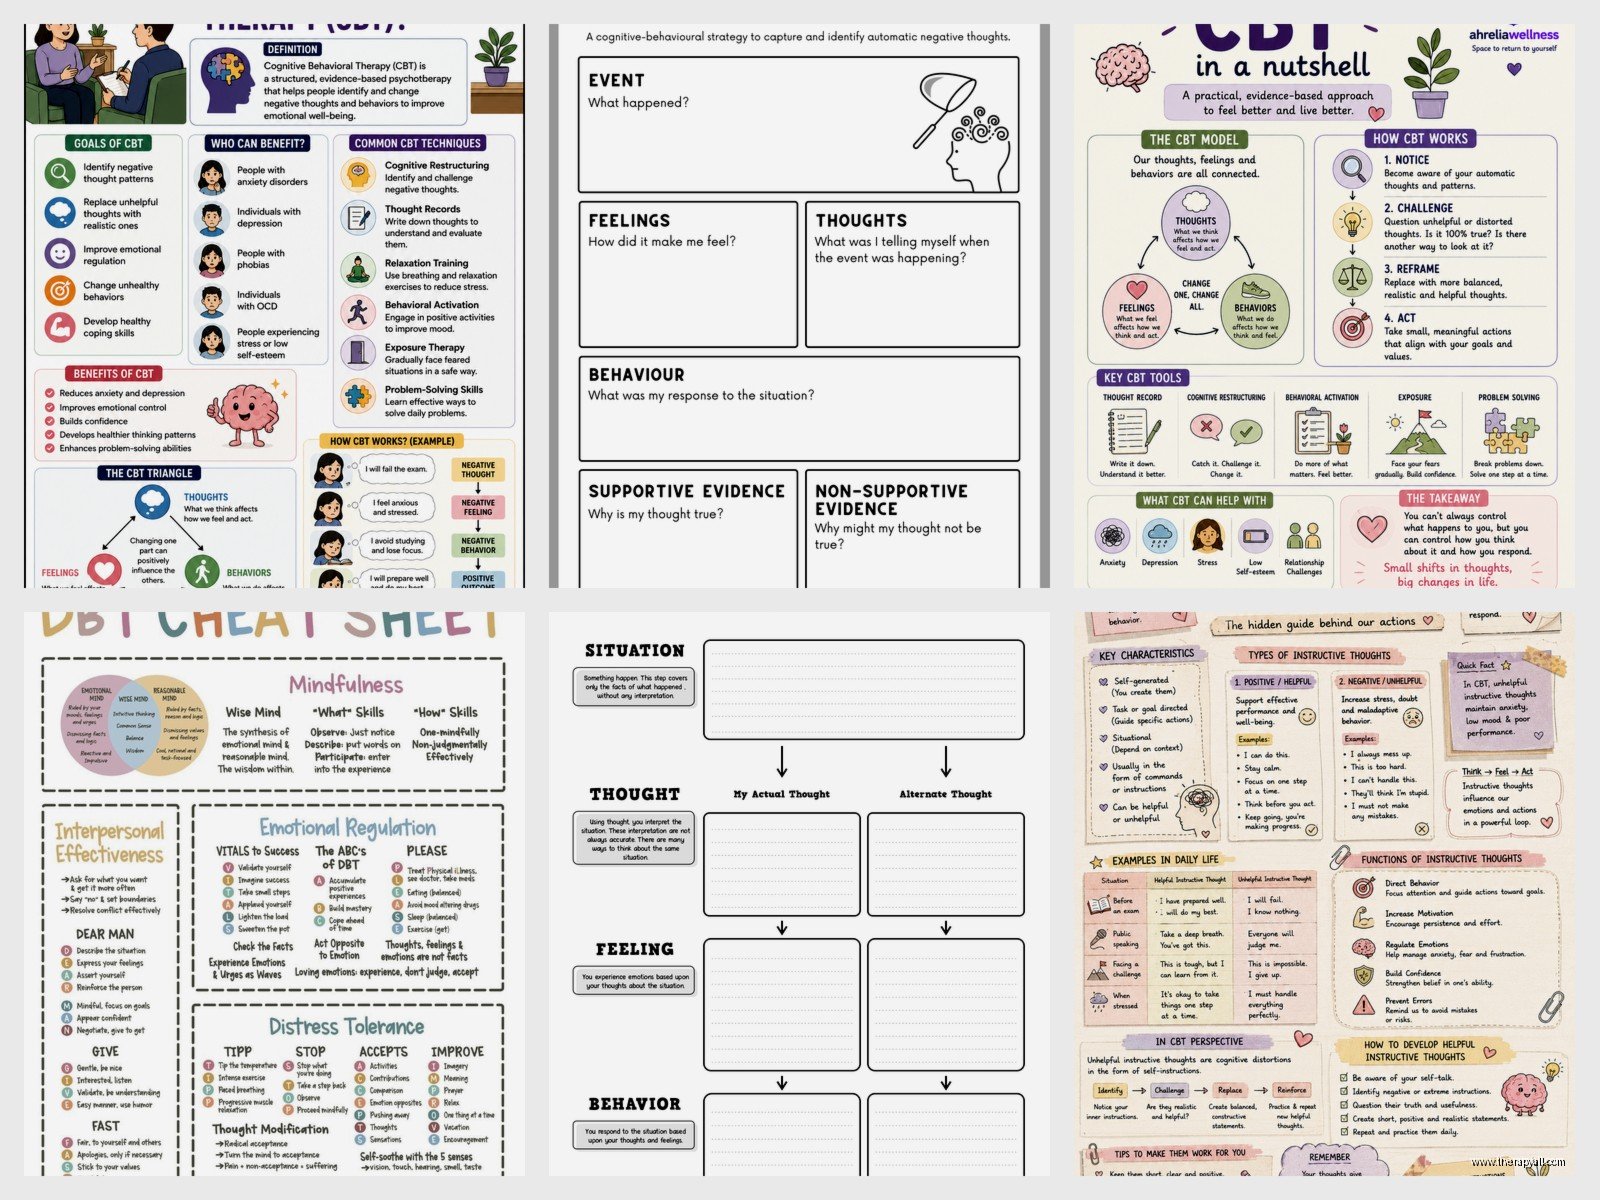
Some charts show this as a triangle with thoughts at the top and feelings and behaviors at the bottom corners. Others use a circle or a flower petal design or—my cat just knocked over my water bottle, hang on—okay, other designs that basically illustrate the same interconnected system.
Different Chart Formats You’ll Encounter
The thought record is probably the most widely used CBT chart format. It’s typically a table with columns for date/time, situation, automatic thoughts, emotions, evidence for and against the thought, alternative thought, and re-rating of emotion. Some versions have seven columns, some have ten. The Beck Institute has their version, David Burns has his version in “Feeling Good,” and basically every CBT therapist has tweaked it to their preferences.
The hot cross bun model is a diagram that looks like, well, a hot cross bun with four quadrants. Thoughts and feelings go on top, physical sensations and behaviors on the bottom, with the situation written above the whole thing. It’s popular in the UK and Australia from what I’ve seen, less common in US-based resources.
The cognitive conceptualization diagram is more complex and maps out your core beliefs, intermediate beliefs, and automatic thoughts in a hierarchical structure. This isn’t really for daily tracking—it’s more like a blueprint of your overall cognitive patterns that a therapist might develop with you over several sessions.
ABC charts come from Rational Emotive Behavior Therapy (REBT), which is kinda like CBT’s older cousin. A is the activating event, B is your belief about it, C is the consequence (emotional and behavioral). Some versions add D for disputing the belief and E for new effect. It’s simpler than most CBT charts but covers similar territory.
How to Actually Fill One Out
Start with a specific situation, not a general problem. “My anxiety” is too vague. “Thursday morning when I was about to present in the team meeting” works. The more specific you are, the easier it is to identify the actual thoughts and patterns involved.
Write down your automatic thoughts as close to verbatim as possible. Don’t clean them up or make them sound reasonable. If your thought was “everyone thinks I’m incompetent and I’m gonna get fired,” write that, not the softened version you’d tell someone else. The raw thought is what you’re working with.
When you’re rating emotions, be honest about the intensity. I’ve seen people consistently rate everything at 50 or 60 because they’re trying to seem balanced or not dramatic, but that defeats the purpose. If your anxiety was a 95, write 95. You’re not gonna get graded on this.
For the evidence columns—this is where people either skip ahead or get really stuck. You’re looking for actual evidence, not more thoughts. “My boss frowned at me” is evidence. “My boss definitely hates my work” is another thought. The distinction matters. Evidence for the thought might include concrete facts that support it. Evidence against might include times when the opposite was true or alternative explanations for what happened.

The alternative thought section is not about positive thinking or affirmations. It’s about coming up with a more balanced or realistic interpretation based on the evidence you just examined. Sometimes the alternative thought is only slightly different from the automatic thought. That’s fine. You’re not trying to completely flip your perspective, just shift it enough to be more accurate.
Common Mistakes That Make Charts Useless
Filling out the chart hours or days after the situation happened means you’re reconstructing from memory, and memory is unreliable, especially for the exact thoughts and emotion intensity you had in the moment. The chart works best when you complete it as close to the event as possible, even if that means jotting quick notes on your phone and transferring them later.
Mixing thoughts and feelings in the same column is probably the mistake I see most often when people show me their charts. “I feel like I’m not good enough” goes in thoughts, not feelings. The feeling might be inadequate, ashamed, or discouraged. Keeping these separate helps you see what you’re telling yourself versus how you’re responding emotionally.
Using the chart only for big crisis moments misses the point. CBT charts are actually more useful for everyday situations where your patterns are easier to spot and change. The coffee shop ran out of your usual order, your friend canceled plans, you got stuck in traffic—these smaller moments reveal your cognitive patterns just as clearly as major events, sometimes more clearly because there’s less emotional intensity clouding things.
Skipping the behavior column because “I didn’t do anything” isn’t accurate. You always do something, even if that something is avoiding, ruminating, or staying in bed. Not taking action is still a behavioral response. Write it down.
What Actually Changes From Using These
The chart itself doesn’t fix anything, which is something that annoys me about how they’re sometimes presented in those “10 CBT worksheets that will change your life!” roundups. It’s a tool for observation first, intervention second. You use it to notice patterns you weren’t aware of before.
After you’ve filled out charts for a couple weeks, you start seeing the same thoughts pop up in different situations. Maybe you notice that you consistently jump to “people are judging me” in social situations, or “I’m going to fail” before challenging tasks, or “nobody cares” when people don’t respond immediately. Those recurring thoughts are your targets for intervention.
The physical sensations column helps you catch the pattern earlier. Once you recognize that tight chest feeling as the start of your anxiety spiral about work performance, you can intervene before the whole cycle plays out. You can’t really change something you’re not aware of, and most people aren’t tracking their physical responses consciously.
You also start seeing which behaviors actually make things worse versus better. Maybe you notice that venting to your friend decreases your anxiety from 80 to 60 temporarily but it’s back at 85 an hour later, while going for a walk brings it down to 50 and keeps it there. The chart gives you data about what actually works for you, not what you think should work.
Digital vs Paper Charts
There are apps now that basically give you a CBT chart in digital form—Thought Diary, CBT Thought Record Diary, MindShift, Sanvello. They’re convenient because you’ve got them on your phone, they can send reminders, and some analyze your patterns over time. The downside is that pulling out your phone to fill out a therapy worksheet in public feels weird to some people, and there’s something about the physical act of writing that helps processing for others.
I personally used paper charts back in summer 2021 when I was writing content about them constantly and figured I should actually try the things I was recommending. Paper worked better for me because I could spread out the page, draw arrows, add notes in margins. But I’ve talked to plenty of people who prefer digital because they can’t lose it and they can search through past entries.
Some people use a bullet journal format and create their own chart layouts. Some use a simple notes app. Some print out PDFs. The format matters less than actually using it consistently enough to gather useful information about your patterns.
When Charts Don’t Work
If you’re in the middle of a panic attack or severe depression episode, a CBT chart is probably not the right tool in that moment. You need immediate coping strategies first, analysis later. The chart is for when you have enough cognitive space to observe and reflect, not when you’re in crisis mode.
Some people find the structure too rigid or the process makes them more anxious because they’re worried about doing it “right.” There’s no right way beyond honest observation, but if the tool itself is creating more stress than insight, it’s not the right fit for you. CBT isn’t one-size-fits-all despite how it’s sometimes presented in mental health content.
Charts also don’t address everything. They’re designed for cognitive patterns, not trauma processing, not relationship dynamics, not systemic problems. If your anxiety is primarily driven by financial instability or discrimination or an abusive relationship, examining your thoughts about it might provide some relief but it won’t solve the actual problem. This is something that bothers me about how CBT tools get marketed sometimes—they’re useful for what they’re designed for, but they’re not a cure-all.
Adapting Charts for Different Issues
For anxiety, you might add a column for safety behaviors—the things you do to try to prevent the feared outcome. For depression, some charts include a column for activity level or pleasure/accomplishment ratings. For anger, you might track the intensity buildup and what happened right before the anger spiked.
Social anxiety charts sometimes include a column for what you think others are thinking about you versus evidence for what they actually said or did. Perfectionism-focused charts might have a section for your standards versus realistic standards. You can customize these templates based on what you’re trying to understand about your patterns.
Some therapists have clients track positive experiences too, not just problematic ones, to notice patterns in what generates positive emotions and helpful thoughts. This is less common but can be useful if you’re trying to build new patterns rather than just interrupt old ones.
Making It Actually Sustainable
Committing to fill out a detailed chart every single day is setting yourself up to quit after a week. Start with tracking maybe three situations per week, or just the ones that really bothered you. You can always increase frequency later if you find it helpful.
Keep the chart wherever you’ll actually use it. If that’s a small notebook in your bag, fine. If it’s a note on your phone, fine. If it’s a specific app, fine. The best CBT chart is the one you’ll actually complete, not the most perfectly designed one sitting unused in a drawer.
Set a specific time to review what you’ve tracked. Maybe Sunday evening you look back at the week’s entries and notice patterns. Without this review step, you’re just collecting data without analyzing it, which is like… I don’t know, buying groceries and never cooking with them or something. The insight comes from looking at multiple entries together, not just filling them out.
You don’t have to use CBT charts forever. Some people use them intensively for a few months to identify their main patterns, then switch to mental check-ins using the same framework without writing it down. Some people return to charts during stressful periods when old patterns resurface. There’s no rule that says you must journal your thoughts for the rest of your life.
ADHD & Neurodiversity
Life Planner Bundle – Life Organizer
Self-Care & Personal Growth
Acceptance And Commitment
Anxiety & Stress
Stress Processing Journal & Reflection Worksheets For Daily Self – Care
Self-Care & Personal Growth
Self – Reflection Guided Journal With Guided Prompts 30
Emotional Wellness
Decision Processing – Thought Processing Journal For Daily Self – Care
Therapist Resources
Physiotherapist Journal PDF Planner Tracker Or Log Book
Self-Care & Personal Growth
Customizable Self – Confidence & Self – Esteem Guided Journal
ADHD & Neurodiversity
ADHD Behavior Tracker PDF Planner Tracker Or Log Book